Create report using reports app
Creating a report consists of three steps: selecting geographies, selecting tables, and viewing/downloading your results. You may use reports to view and export one or thousands of variables and geographies quickly and easily.
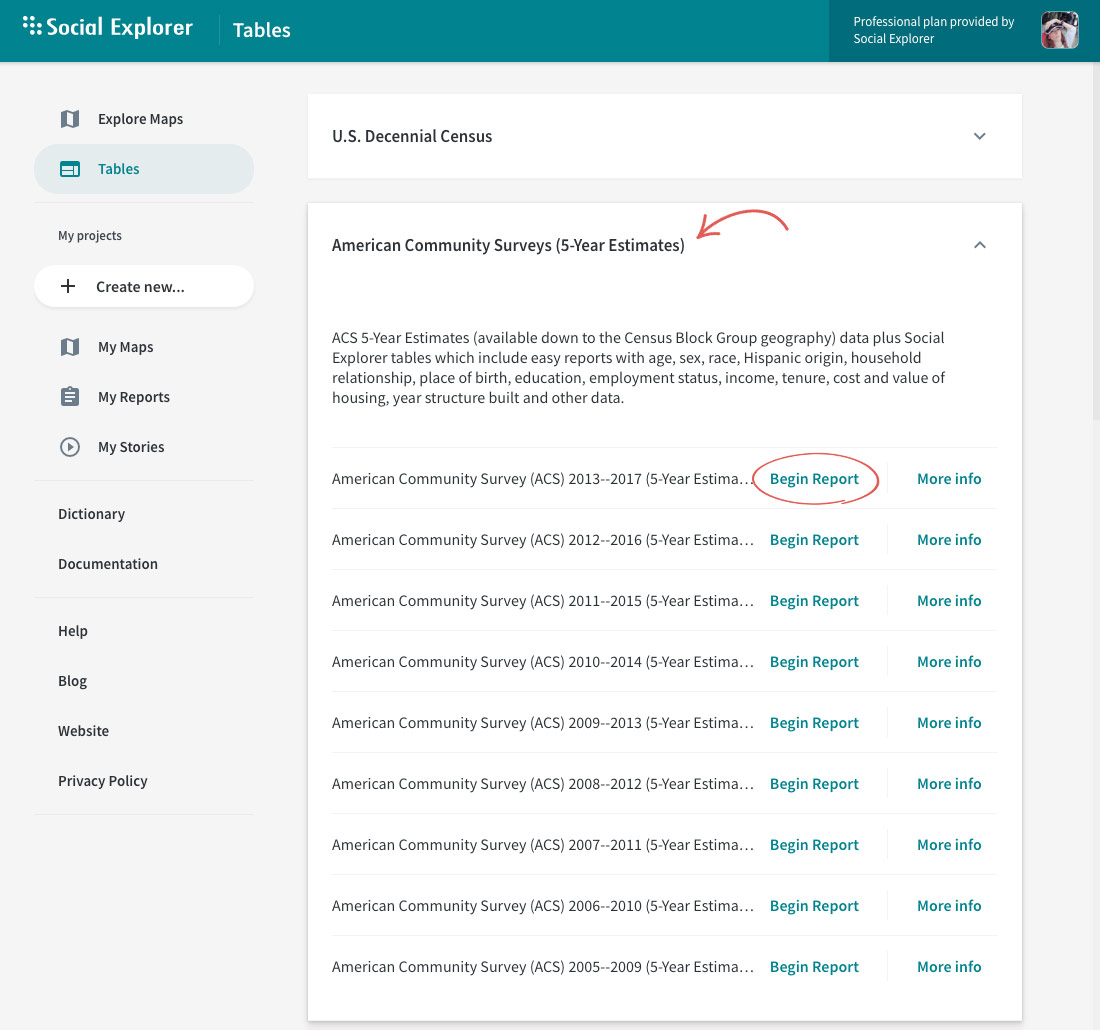
- Head over to the Tables page.
- Select the survey you're interested in.
- Click Begin report next to the survey year you want to explore.

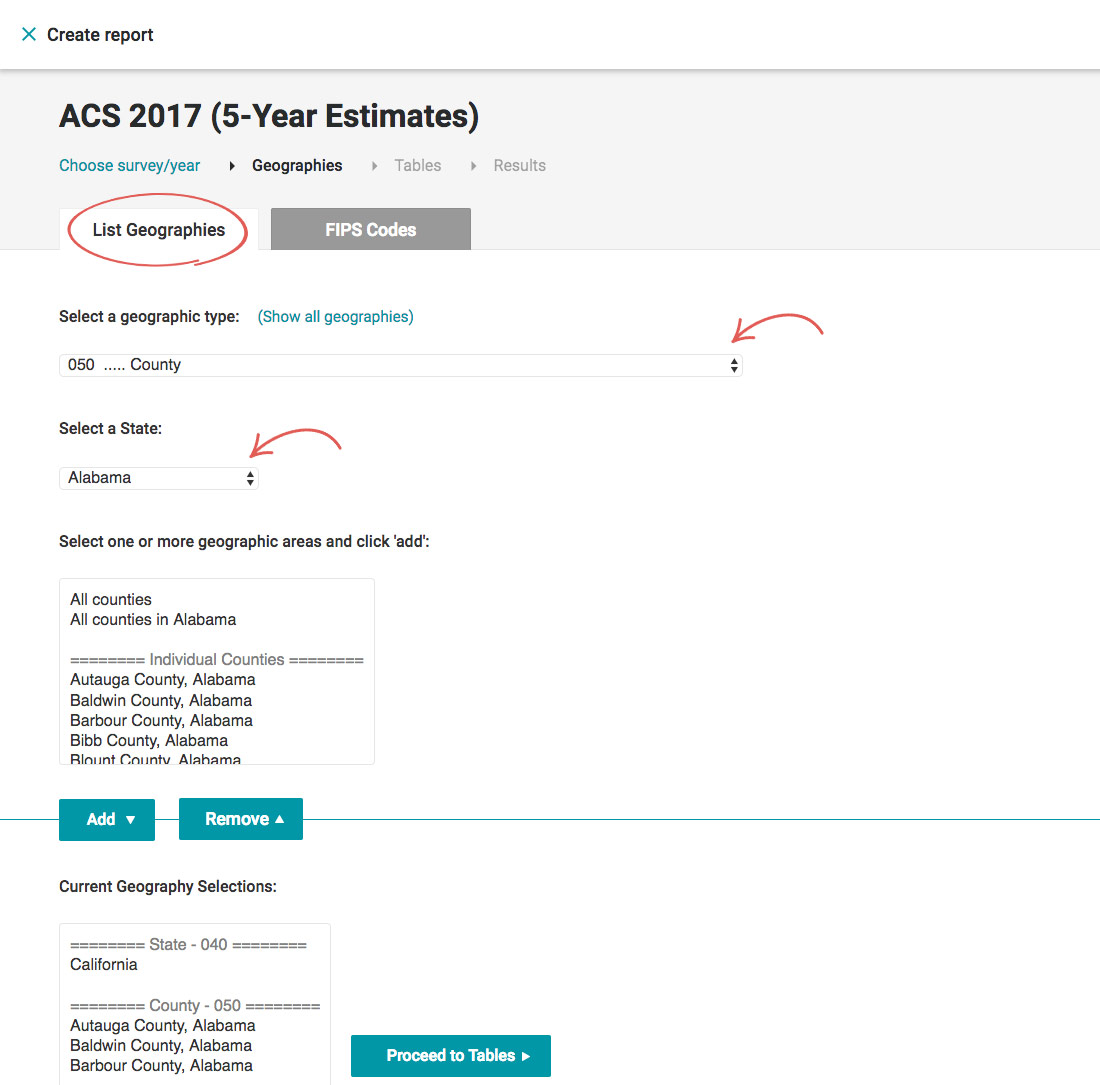
- Select the geography type from the dropdown menu: nation, state, or county.
- Select one or more geographic areas and click Add.
Repeat steps 4 and 5 until you have selected all the geographies you need. You can add a mixture of geography types (such as nation, county, and census tract), all in a single report. You may also select All Census Tracts in the United States or All Counties in Alabama.
- Click Proceed to Tables.

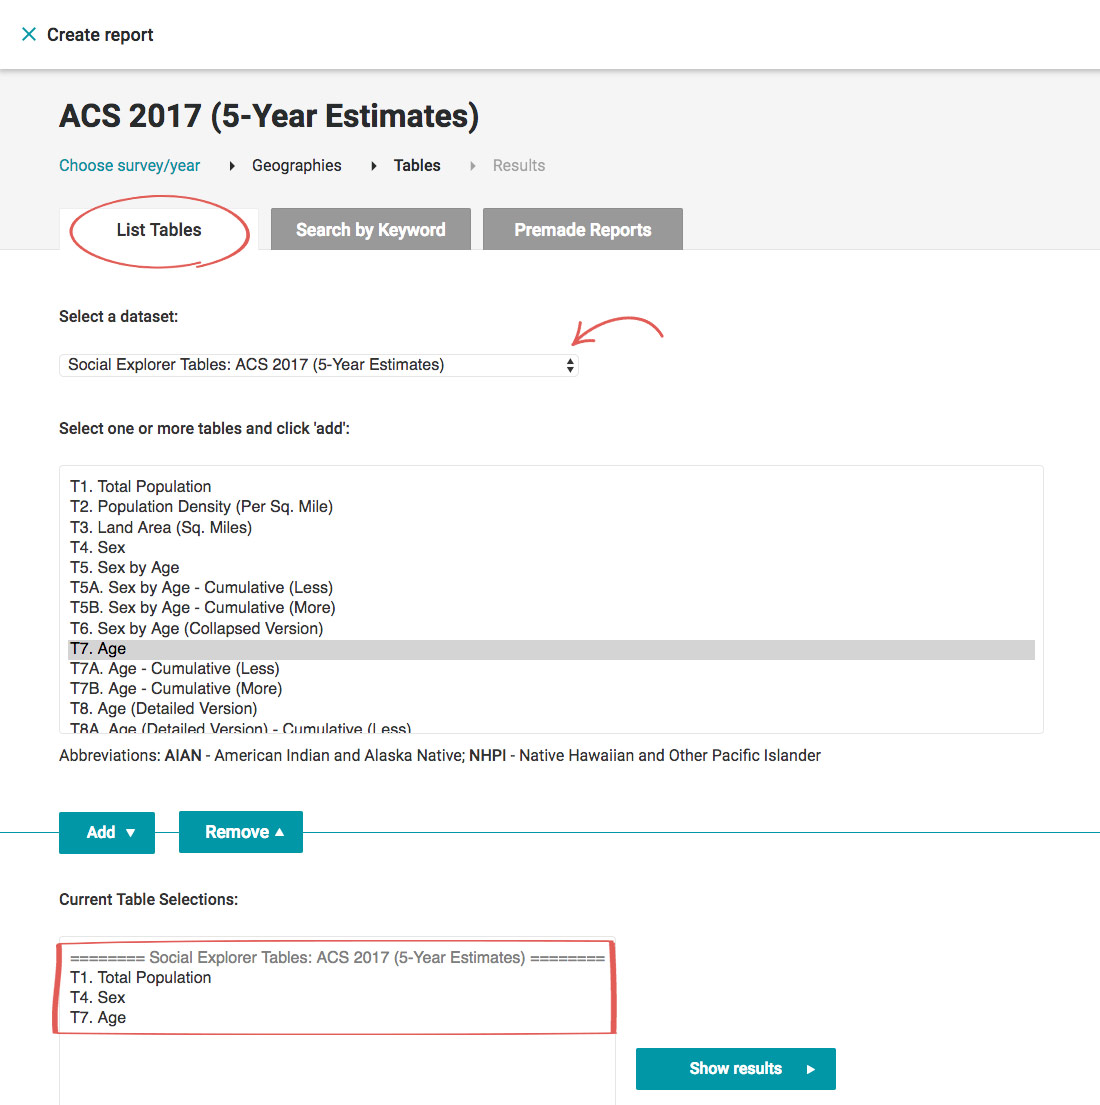
- Select a dataset.
For certain surveys, we included both the original, unabridged dataset and the dataset we preprocessed with the most popular variables.
- Select one or more tables and click Add.
- Click Show results.

You may also use Premade reports which are made from pre-selected tables that relate to a particular topic. These reports are a great way to get started. You can then switch back to Tables List to customize table selections.
Read more about working with reports in this guide: Getting started with reports.